
Connect to the Inspector MCP server
Start the local Inspector MCP server, connect an MCP client, and verify the endpoint and enabled tool access.
What you connect
Inspector provides a local MCP server for an MCP client such as GitHub Copilot in VS Code. The server exposes the current Visual Components session through a Streamable HTTP endpoint; the server itself does not provide the AI reasoning.
The default endpoint is:
http://localhost:3000/mcp
The port is configurable. Use the URL shown by Inspector after changing it, because the client URL must match the running server.
Start the server
- Open the HOME tab in Visual Components.
- In the Inspector group, select MCP Server.
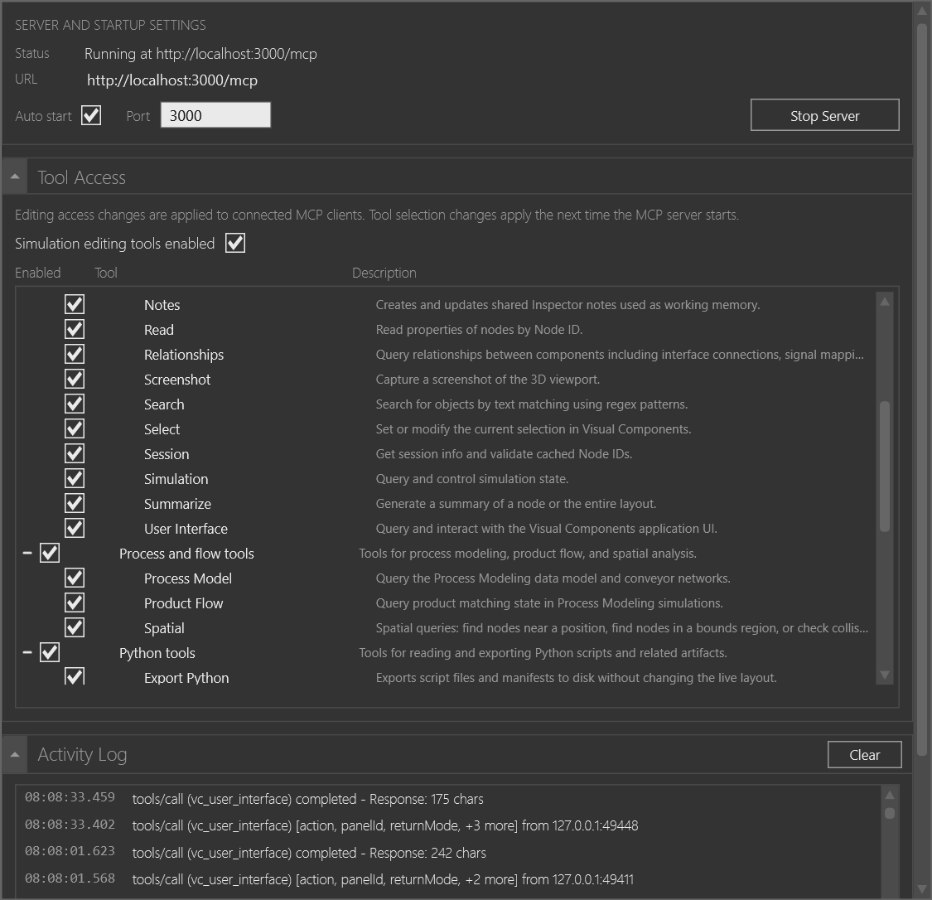
- In Server and startup settings, check Status and URL.
- Select Start Server when the status is Stopped.
- Leave Auto start selected when the server should start with Visual Components.
The configuration window is a reversible UI action. Starting or stopping the server changes client availability, but does not change the layout.
Configure the endpoint
Set the MCP client server URL to the exact value shown in Inspector. This workspace uses the following public configuration entry:
{
  "servers": {
    "visual-components": {
      "type": "http",
      "url": "http://localhost:3000/mcp"
    }
  }
}
The checked-in .vscode/mcp.json also contains winapp and
documentation-tools stdio entries for this documentation workspace. They are
support services for authoring and native UI verification, not additional
Inspector layout-data endpoints.
After the client connects, its MCP server list should contain the
visual-components server. A client can then initialize the connection and
request the available tools from the running Inspector process.
Control tool access
Use Tool Access to enable or disable individual tools or a complete tool group. Inspector reports that editing access changes are applied to connected clients, while tool selection changes apply the next time the MCP server starts.
- Read-only inspection tools are enabled by default in the tool metadata.
- Edit-capable tools are grouped separately and are disabled until the simulation-editing access gate is enabled and confirmed.
- Review the current checkboxes in your own session before sending an action through an external client.
See Inspector MCP tool access for the complete tool list and the difference between reading, UI state changes, file output, and live edits.
Check a connection
Use the Activity Log in the configuration window to confirm requests and responses. A running status with a matching URL and recent client activity is the useful connection result.
If the client cannot connect:
- Check that Visual Components is still running and Status is not Stopped.
- Compare the client URL with the displayed URL, including the
/mcppath. - Check for a port conflict by trying a different Port, then start the server and update the client URL.
- Restart the MCP server after changing tool selection.
- Use the activity log to distinguish a missing client request from a tool execution error.
Related tasks
Use Inspect a layout through MCP for a read-focused investigation sequence. See Configure Copilot Chat for the Inspector Chat endpoint, which is derived from the same server settings.